PMP

Georgetown Performance Management Program (PMP)

2021 Certificate of Achievement in Performance Management logoThe City of Georgetown developed a citywide Performance Management Program (PMP) in 2017 to further integrate the City Council and City Manager’s strategic planning with operations.

The PMP is based upon a department’s mission in a manner that aligns with the City’s Vision and reinforces the City’s Core Values.  The PMP helps monitor productivity and performance, while identifying trends and patterns to understand when a service area is strained or hitting on all cylinders.

The purpose of the PMP is to align employees around a common vision, focus teams on their missions, reinforce commitments that form the culture, and drive continuous improvements and employee development to deliver superior performance.

This dashboard is comprised of a cross-section of metrics from City departments and service areas, but it is not a comprehensive list of metrics that are tracked within the City. The data is updated on a semi-annual basis and provides insight to department operations and quality of services. These metrics are indicators for specific functions related to departments, but they are not an indicator of the overall performance of the department.

WE ARE…VISION INSPIRED, MISSION FOCUSED, VALUES DRIVEN, & PERFORMANCE BASED


Result Legend
Metric is meeting all expected targets within the fiscal year.
Metric is meeting the majority of expected targets within the fiscal year.
Metric is not meeting the majority of expected targets within the fiscal year.

For questions about the metrics or the Performance Management Program, please contact us at ooe@georgetown.org.


Service Area/ Department Measure Result
Animal Services
Mission: Serve our community, act with compassion.
Length of stay (dogs and cats)
Communications and Public Engagement (CAPE)
Mission: Foster pride in Georgetown through honest, proactive, and creative communications.
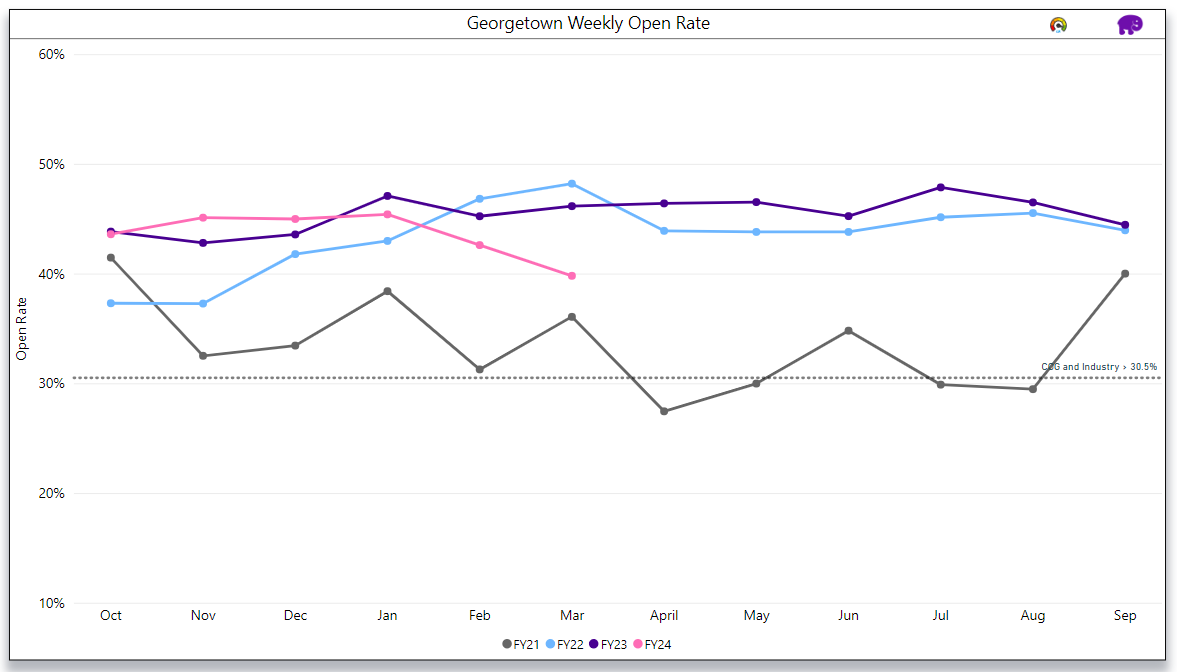
Average Georgetown Weekly e-newsletter open rate
Electric
Mission: To provide reliable energy and responsive restoration for our customers through effective maintenance and safe work practices by highly trained and professional workforce that takes pride in its’ craft.
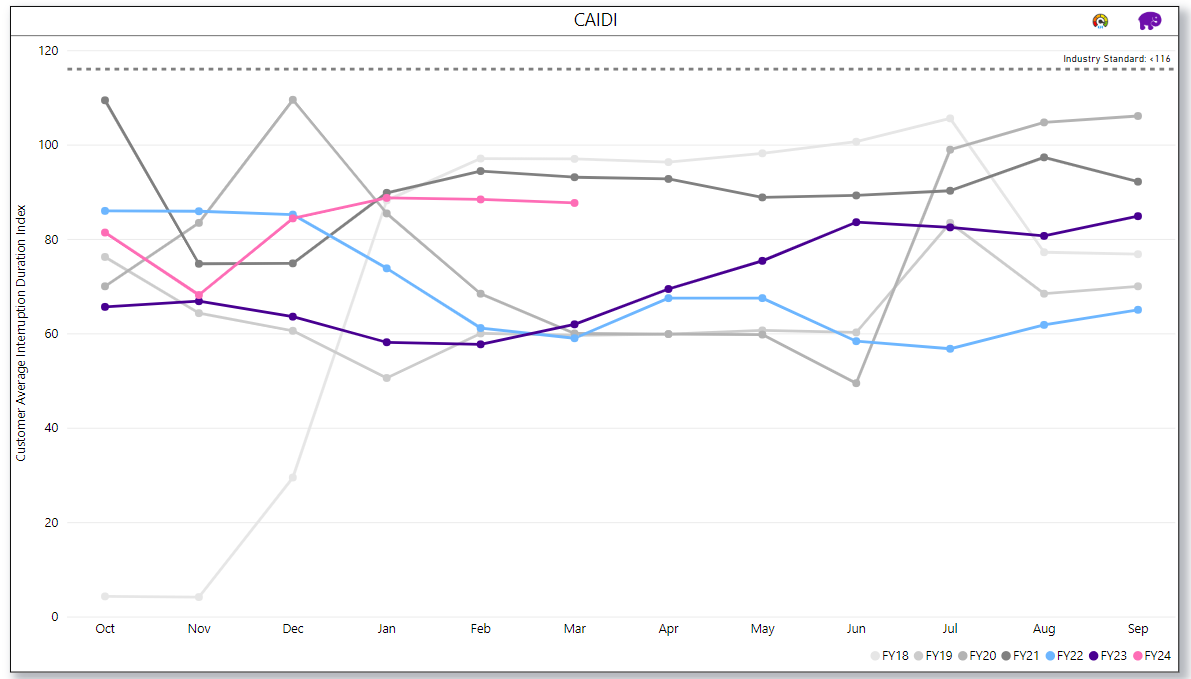
Customer Average Interruption Duration Index
Fire
Mission: Prepare, prevent, protect, and provide professional services to the City of Georgetown and surrounding region.
Priority Response Time Performance
Planning
Mission: Actively preserve the community’s heritage and shaping its future by implementing the City’s adopted vision and promoting a high-quality built environment.
Turnaround time for Rezoning cases
Police
Mission: To be the standard in law enforcement through leadership, innovation, and a commitment to excellence.
Response times for priority calls
Recreation
Mission: Create an environment that provides opportunities for positive experiences and personal growth.
Customer satisfaction
Water
Mission: Provide Water Services to the community that are vital to public health by working together as skilled licensed professionals to operate and maintain the water and wastewater system.
Utility Reliability
Animal Services
  • Measure Metric Definition Target Result
    Length of stay for dogs (in days) Number of days before a dog is dispositioned. <15 days
    Length of stay for cats (in days) Number of days before a cat is dispositioned. <15 days

Animal Services: Length of Stay (dogs) chart

Animal Services: Length of Stay (cats) chart

Performance:

The shelter tracks and evaluates length of stay for dogs and cats within their facility and is constantly looking for ways to reduce this metric to get animals into good homes. Staff implemented a variety of ways to achieve this, that included appointments to keep operations manageable for staff during the pandemic, recently becoming certified in the Fear Free Shelter Program, and training on dog playgroups conducted by Dogs Playing for Life. As a result, length of stay (LOS) for both dogs and cats are at all-time lows.

Why is this metric important?

Length of stay is a critical element in shelter management. A shelter’s capacity to save lives is ultimately dependent on LOS because of the implications for animal health, well-being, and overall costs. An increased LOS is recognized as the most significant risk factor in achieving a positive outcome for shelter dogs and cats. There is a noticeable strain on space, a greater need for environmental enrichment and interaction, and an increase in confinement-related stress and illness the longer an animal is housed at a shelter.

Communication and Public Engagement
  • Measure Metric Definition Target Result
    Average Georgetown Weekly e-newsletter open rate The number of unique newsletter opens divided by the number of subscribers send the newsletter 26.7%

Communication and Public Engagement: Georgetown Weekly Open Rate

Performance:

Each Thursday, the Communications and Public Engagement Department (CAPE) publishes the Georgetown Weekly, an e-newsletter that contains timely and important information from the City or that affects Georgetown residents. Our goals with this weekly e-newsletter are to a) be transparent; b) create an informed citizenry; and c) increase awareness about important issues and events happening in the City. The newsletter covers such topics as:

  • Department news, including transportation projects, street closures, and utility updates
  • Groundbreakings and ribbon-cutting ceremonies
  • Council agendas and recaps
  • Upcoming events
  • Conservation tips
  • Employee recognitions
  • Citywide observances
  • Pet of the week

The department has worked to improve the quality of content in the newsletter by adding content posted to our social media pages and updating its look and organization with our City brand.

One way we know if our newsletter is valued by our readers is through our open rate, which is a percentage calculated by dividing the number of unique newsletter opens by the number of subscribers. The benchmark we use for open rates is 26.7 percent and is based on the average government and politics newsletters for 2020 that was established by research from our newsletter vendor, Emma. We track the average open rate for each month, which is what you will see reported here. In the past year we have seen open rates consistently improve, while at the same time our number of subscribers has increased. This is significant because we know more people are receiving the newsletter and opening it, which means more people in Georgetown are seeing what we are publishing thus meeting our goal of informing our residents.

Why is this metric important?

The newsletter provides important information Georgetown residents need to know. It reaches a different audience from our social media followers and serves as a more timely complement to our monthly utility bill insert. We track this metric regularly, so we know whether people are receiving our information. Knowing how the newsletter performs helps us determine what is and is not working, so we can adjust accordingly.

Electric
  • Measure Metric Definition Target Result
    Customer Average Interruption Duration Index This index illustrates the average outage duration that any given customer would experience each month. <116


Performance:

Average outage duration by minutes per year is measured against industry standards to ensure the department is delivering reliable services to customers. The department is consistently below their target of 116 average outage duration in minutes per year, and well below the alert level of 200 average outage duration minutes.

Why is this metric important?

This metric provides a good indicator related to outage response and repair. In total the metric measures our response time (when we are aware of the outage), travel time, repair time and when we have restored power. For each outage we use this metric to look for improvement opportunities to improve response times and reduce the outage times customers experience.

Fire
  • Measure Metric Definition Target Result
    Priority Response Time Performance Goal of a 9-minute or less response time to 90% of incidents. Response times includes call processing, dispatch, turnout, and travel. >85%
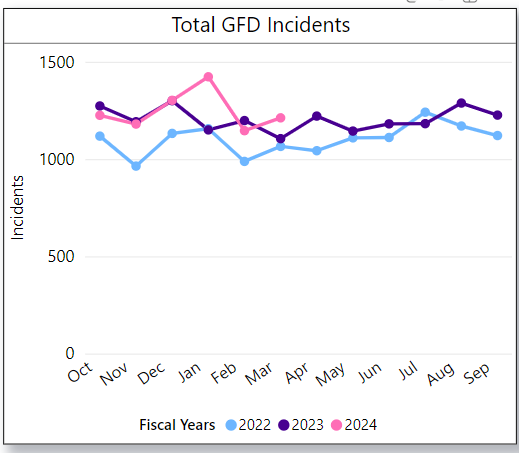
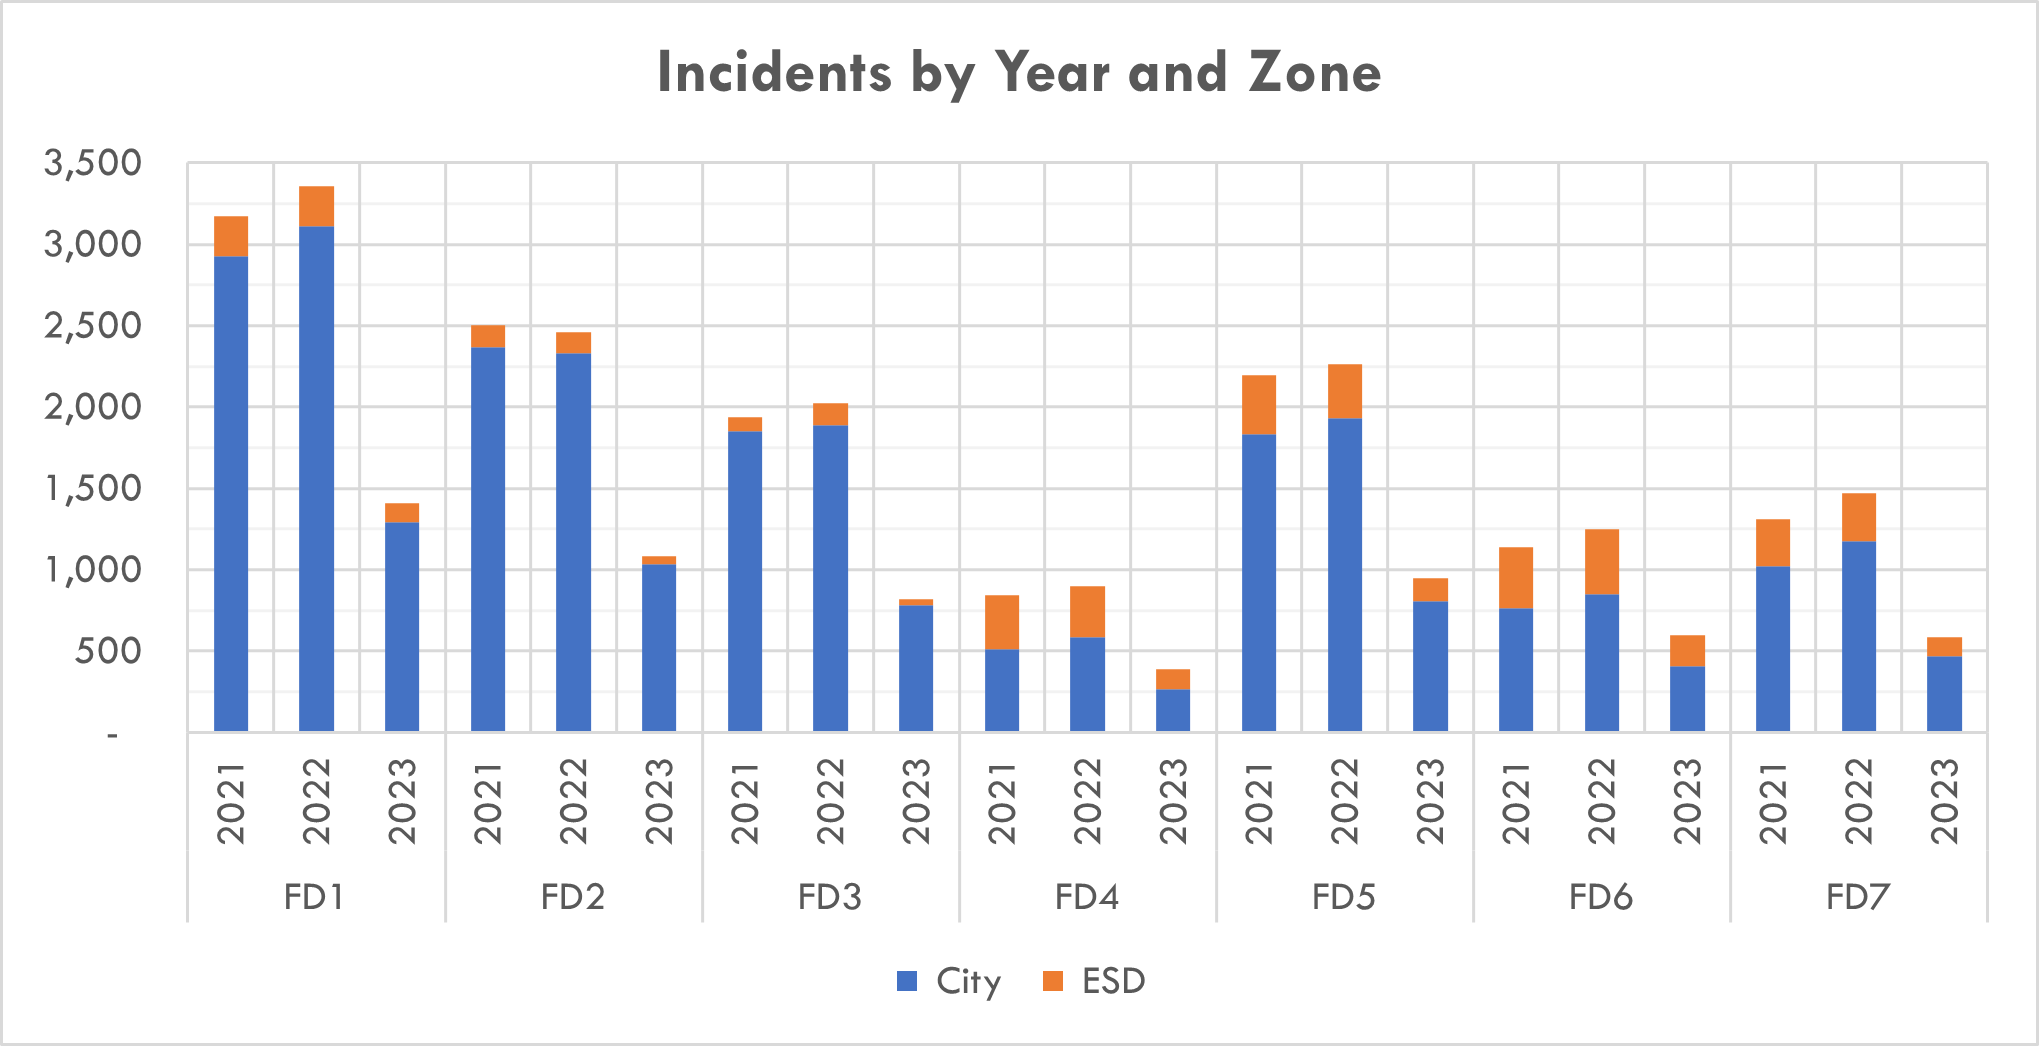
    Fire/EMS Demand Measure monthly incident trends across the city.
    Priority Response Time Performance Measures annual incident demand for each station to determine stress and/or resiliency.

Fire Department: Priority Response Time Within 9 minutes Performance chart

Fire/EMS Demand chart: Measure monthly incident trends across the city.

Incident demand by fire station chart.

Performance:

Priority responses require fire, medical and rescue crews to respond with lights and sirens to critical life safety events. Examples include motor vehicle collisions, heart attacks, strokes, drownings, gas leaks, building fires, and related emergencies.

Our goal is to arrive to 90% of all priority emergency events within 9-minutes of the 911 call. The 9-minute performance includes the call processing, dispatch, turnout, travel and arrival time(s).

Why is this metric important?

Georgetown Fire Department’s goal is to get there quickly, solve the problem, and treat people nicely. This can best be accomplished through an expedient response that minimizes delay(s). A variety of factors can cause reduced availability and include concurrent call demand, concentration of incident demand, geographic size of planning zone, road closures, and staffing plans. The metric helps identify the availability and reliability of emergency resources. Specifically, it helps us identify trends in resources allocation, concurrent incident demand, and system resiliency.

We evaluate response time performance with incident demand to paint a better picture of system stress and resiliency.

Planning
  • Measure Metric Definition Target Result
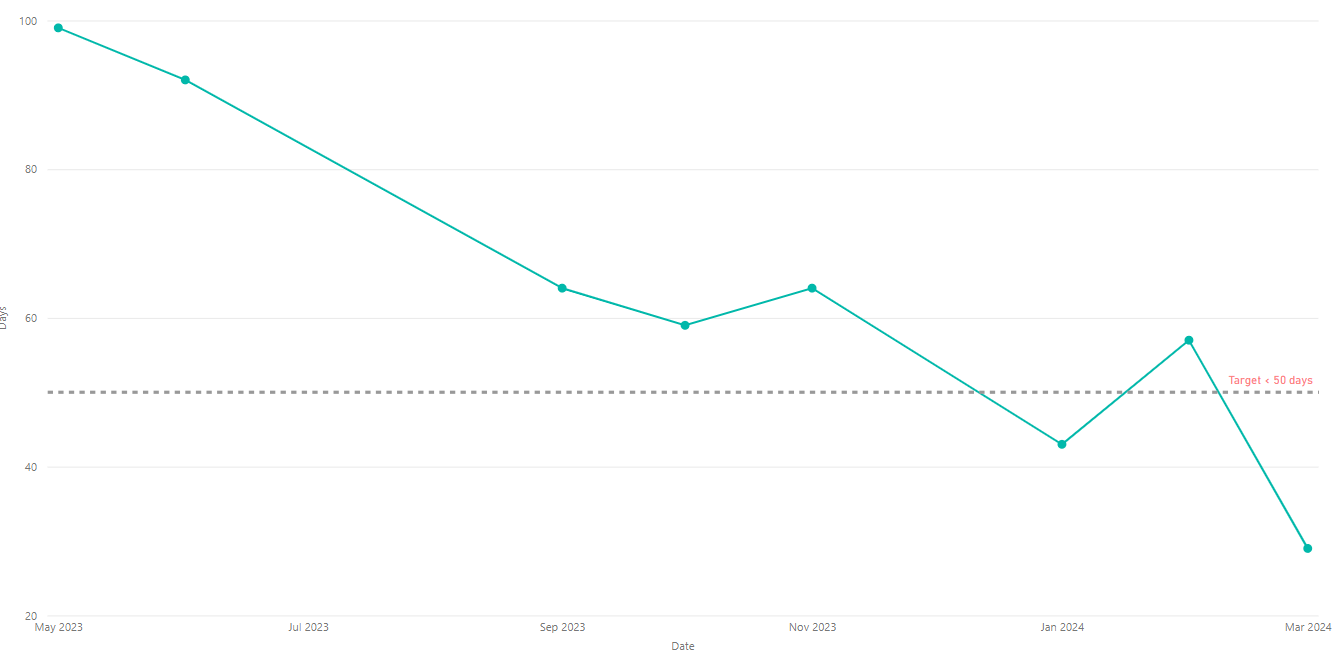
    Rezoning number of days before P&Z meeting Average number of days before Planning and Zoning Commission consider a Rezoning Item <50 days

Planning Department: Number of days before planning and zoning meeting chart

Performance:
The Planning Department has been tracking a number of measures including application submittals, subdivision reviews, and average workdays per completeness review for the past several years. While experiencing a 10% increase in the total number of applications received in Fiscal Year 2020, they were able to dramatically reduce the number of days it takes to review and bring a rezoning application to the Planning and Zoning Commission for consideration. The average number of days it took in Fiscal Year 2020 was 40.

When this metric was originally developed, the target was set at 60 days. Through evaluation and small improvements, the Planning Department was able to reduce the number of days it took before an item is heard at Planning and Zoning Commission. As a result, the team readjusted the target to an average of 50 days. Currently, for Fiscal Year 2021, the average number of days before a rezoning request is heard is 49 days, even though the department has experienced an 88% increase in number of rezoning applications received year to date. There have been a few applications that have taken additional time that resulted in the department not meeting the desired target.

Why is this metric important?
Rezonings are often the first step in the development process. This step determines how a property can be used and developed. This measure is important as it is often a critical step in evaluating whether a property will or will not work for the proposed use. Measuring the number of days it takes to receive an initial decision is helpful in establishing a predictable timeline for a development.

Police
  • Measure Metric Definition Target Result
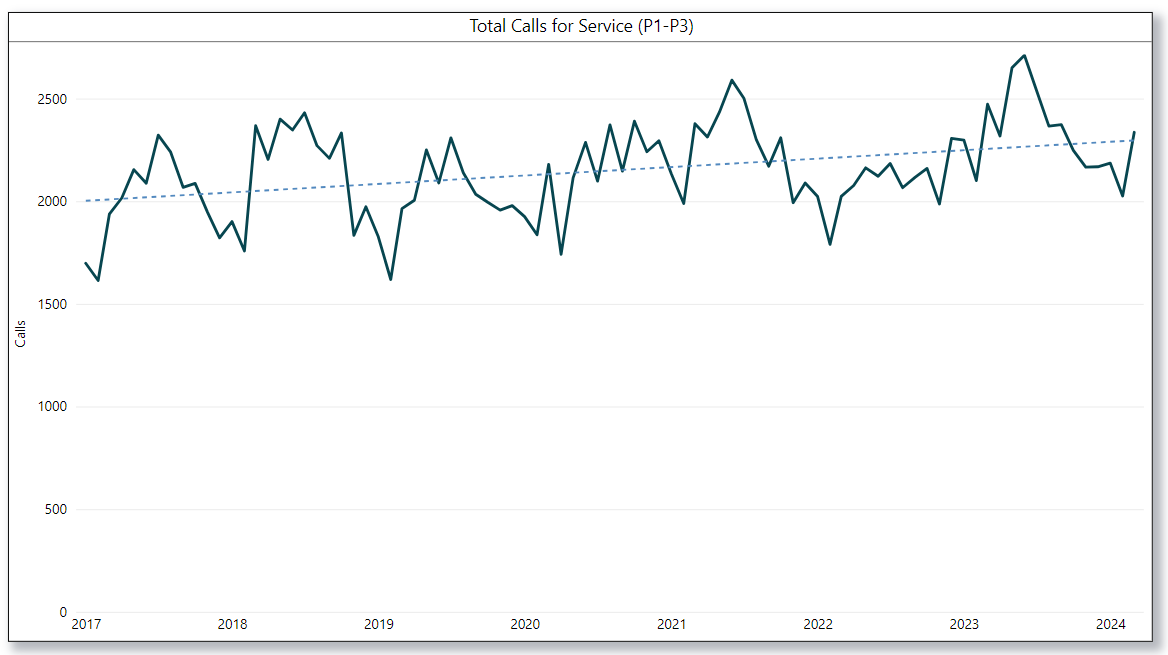
    Priority Calls Number of priority calls received each month No target
    Priority Call Response Time Average number of minutes for Police to respond to a priority 1 calls. <7 minutes

Police Department: chart showing the Number of priority calls received each month

Police Department: chart showing the response times for priority calls

Performance:

Police calls for services are divided into three call categories: P(Priority), P2, and P3. Priority (P) calls are the most serious calls for service such as shots fired, fight in progress, burglary in progress, etc.

Response times measure the ability of the Police Department to intake a call, deploy resources, and have officers arrive on scene.

Police response to priority (P) calls for service directly correlates to public safety and is a critical component of determining appropriate staffing levels for patrol. There was a 25% increase in the number of priority calls in Fiscal Year 2020 and to date there is an 11% increase in priority calls for Fiscal Year 2021. The average response time has increased by 4% due to increased demands and priority calls. In the FY2021 Budget, new patrol officers were added to improve response times and overall safety. The department continues to diligently recruit officers to fill those open positions.

Why is this metric important?

The mission of the police department is to serve with honor, protect with vigilance. The department’s ability to respond quickly and efficiently to priority (P) calls is critical to our mission.  (P) calls are the most critical calls for service, often pose a significant threat to life and property, and necessitate a fast police response. The department’s goal is to respond within 7 minutes to (P) calls for service.

Recreation
  • Measure Metric Definition Target Result
    Overall customer satisfaction Based on survey data, the percentage of customers that are satisfied with the services provided by the Recreation Department. >90%
    Net Promoter Score Measures the loyalty of customers to an organization/service. evaluating target

Recreation Center: Customer Satisfaction of the rec center and tennis center chart

Recreation Center: chart showing the measurement of the loyalty of customers towards the rec center
Measures the loyalty of customers to an organization/service.

Performance:
The Recreation Department continues to use surveys to garner feedback from members and guests to gauge customer satisfaction. This year the department has expanded their tools and implemented a Net Promoter Score to continue to evaluate customer satisfaction and brand loyalty. They have maintained above a 95% customer satisfaction rating for the past year, excluding those months facilities were closed due to the pandemic. The Net Promoter Score was introduced in July 2020 and the initial responses have been very positive with ratings above 70.

Why is this metric important?

The Recreation Department values its customers as well as their feedback. All information obtained through surveys is evaluated and considered during the decision-making process. Actionable common thread topics are utilized when determining service area goals and objectives.

Water
  • Measure Metric Definition Target Result
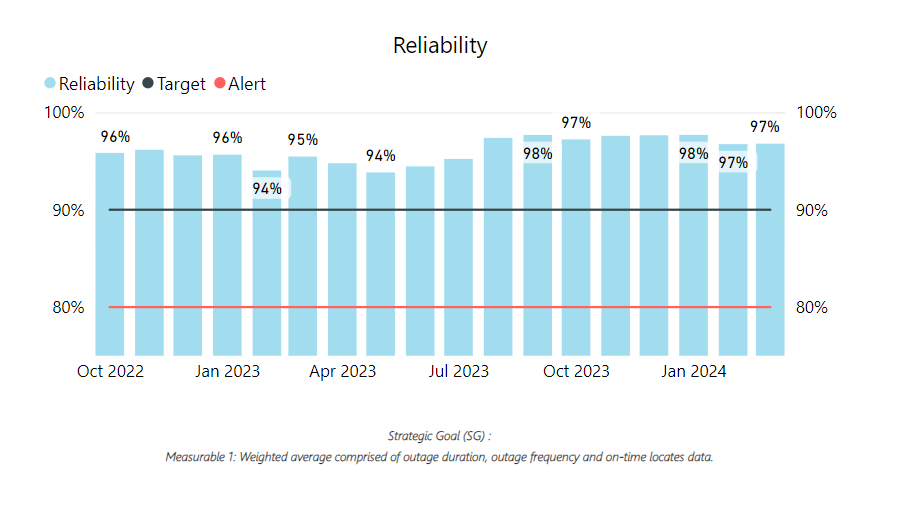
    Reliability Weighted average calculation using utilities outage duration, outage frequency, and on-time line locates data. >90%

Water Department: Reliability chart

Performance:

The Water Department understands that reliability of water delivery must be of high priority. Reliability of services is measured by using data related to outage duration, outage frequency, and on-time line locates. This reliability score is derived by converting the data to a score based on a 0 to 100 scale. Low outage duration and frequency as well as timely line locates have contributed to the department maintaining a score well above the target of 90% consistently for the past year.

Why is this metric important?

Reliability is extremely important as it relates to public health, quality of life, fire protection, and customer relations.

Print Friendly, PDF & Email

Click here to sign up for the Georgetown Weekly newsletter.
Click here to view our Twitter page. Click here to view our facebook page. Click here to view our Nextdoor page. Click here to view our Youtube page.
Click here to sign up for alerts.
image: City of Georgetown Texas logo

X
X